How to Map the Customer Journey on Your Website

Do you know how your customers are using your website? Website analytics can give you some information, but the best way to develop a holistic understanding of what customers experience when using your website is to create a customer journey map.
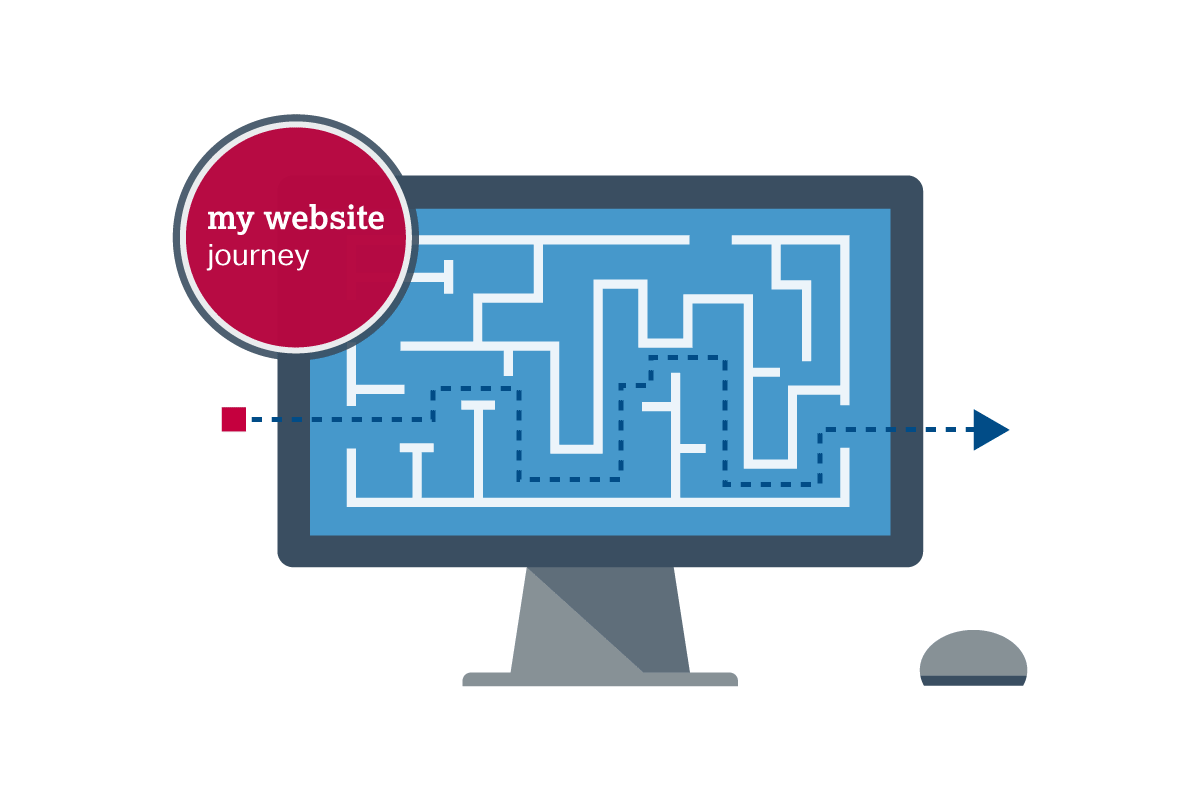
A customer journey map is a visual representation of the path a visitor takes through your website from when they first enter the site till when they leave it, showing all the ways they interact with the website as they move toward their desired goal.
Mapping the customer journey can not only give you a better idea of how your visitors use your site, it can show what actions they take to accomplish specific tasks, identify points of friction they experience, and determine whether they are able to successfully achieve their goals.
A customer journey map includes such important information as:
- What pages people visit, and in what order
- The specific steps customers take to achieve their desired results
- All the points of interaction between your company and your customer via the website
- Which aspects of your site people find helpful and which they find frustrating
- Where you need to be providing support, from brand discovery through post-purchase
Creating a Customer Journey Map
A customer journey map can take many different forms—from a collection of sticky notes on a whiteboard to a complex flow chart with lines showing all the pathways a customer might take—but the easiest way to create a customer journey map is with a simple spreadsheet.
Before you begin, you need to select your target customer personas—profiles of the people who are most likely to use your site, which should include their basic demographics, motivations, priorities, buying behaviors, and decision-making criteria.
For each target persona, create a customer journey map by opening a new worksheet. Label the first column "Current Customer State," and the remaining columns "Step 1," "Step 2," and so on.
You will use the rows under the "Current Customer State" column to collect important data on the customer experience as they move from step to step on your site. You can use as many rows as necessary to collect all the information you deem important about what the customer experiences during each step.
For example:
- Motivations: What the customer is thinking and feeling at each step.
- Actions: What the customer does during each step.
- Pain Points: Problems, frustrations, or points of friction each step may cause.
- Touchpoints: All the ways in which a customer might make contact with the site or the company (clicking a call to action or a link, emailing customer support, activating live chat, etc.) during each step.
- Suggestions: Insights as to how each step could be changed to improve the customer's experience.
Improving the Customer Experience
Once you have a firm understanding of the customer journey, you can use that knowledge to improve your site by eliminating extra steps, smoothing out frustration points, honing your messaging to match customer needs, and even creating content to help educate and support the customer as they travel through your site.
Those changes, because they are aligned with the customer journey, will ensure your website is providing a seamless and effective interaction for customers, which leads to a better user experience and a successful relationship with your brand.